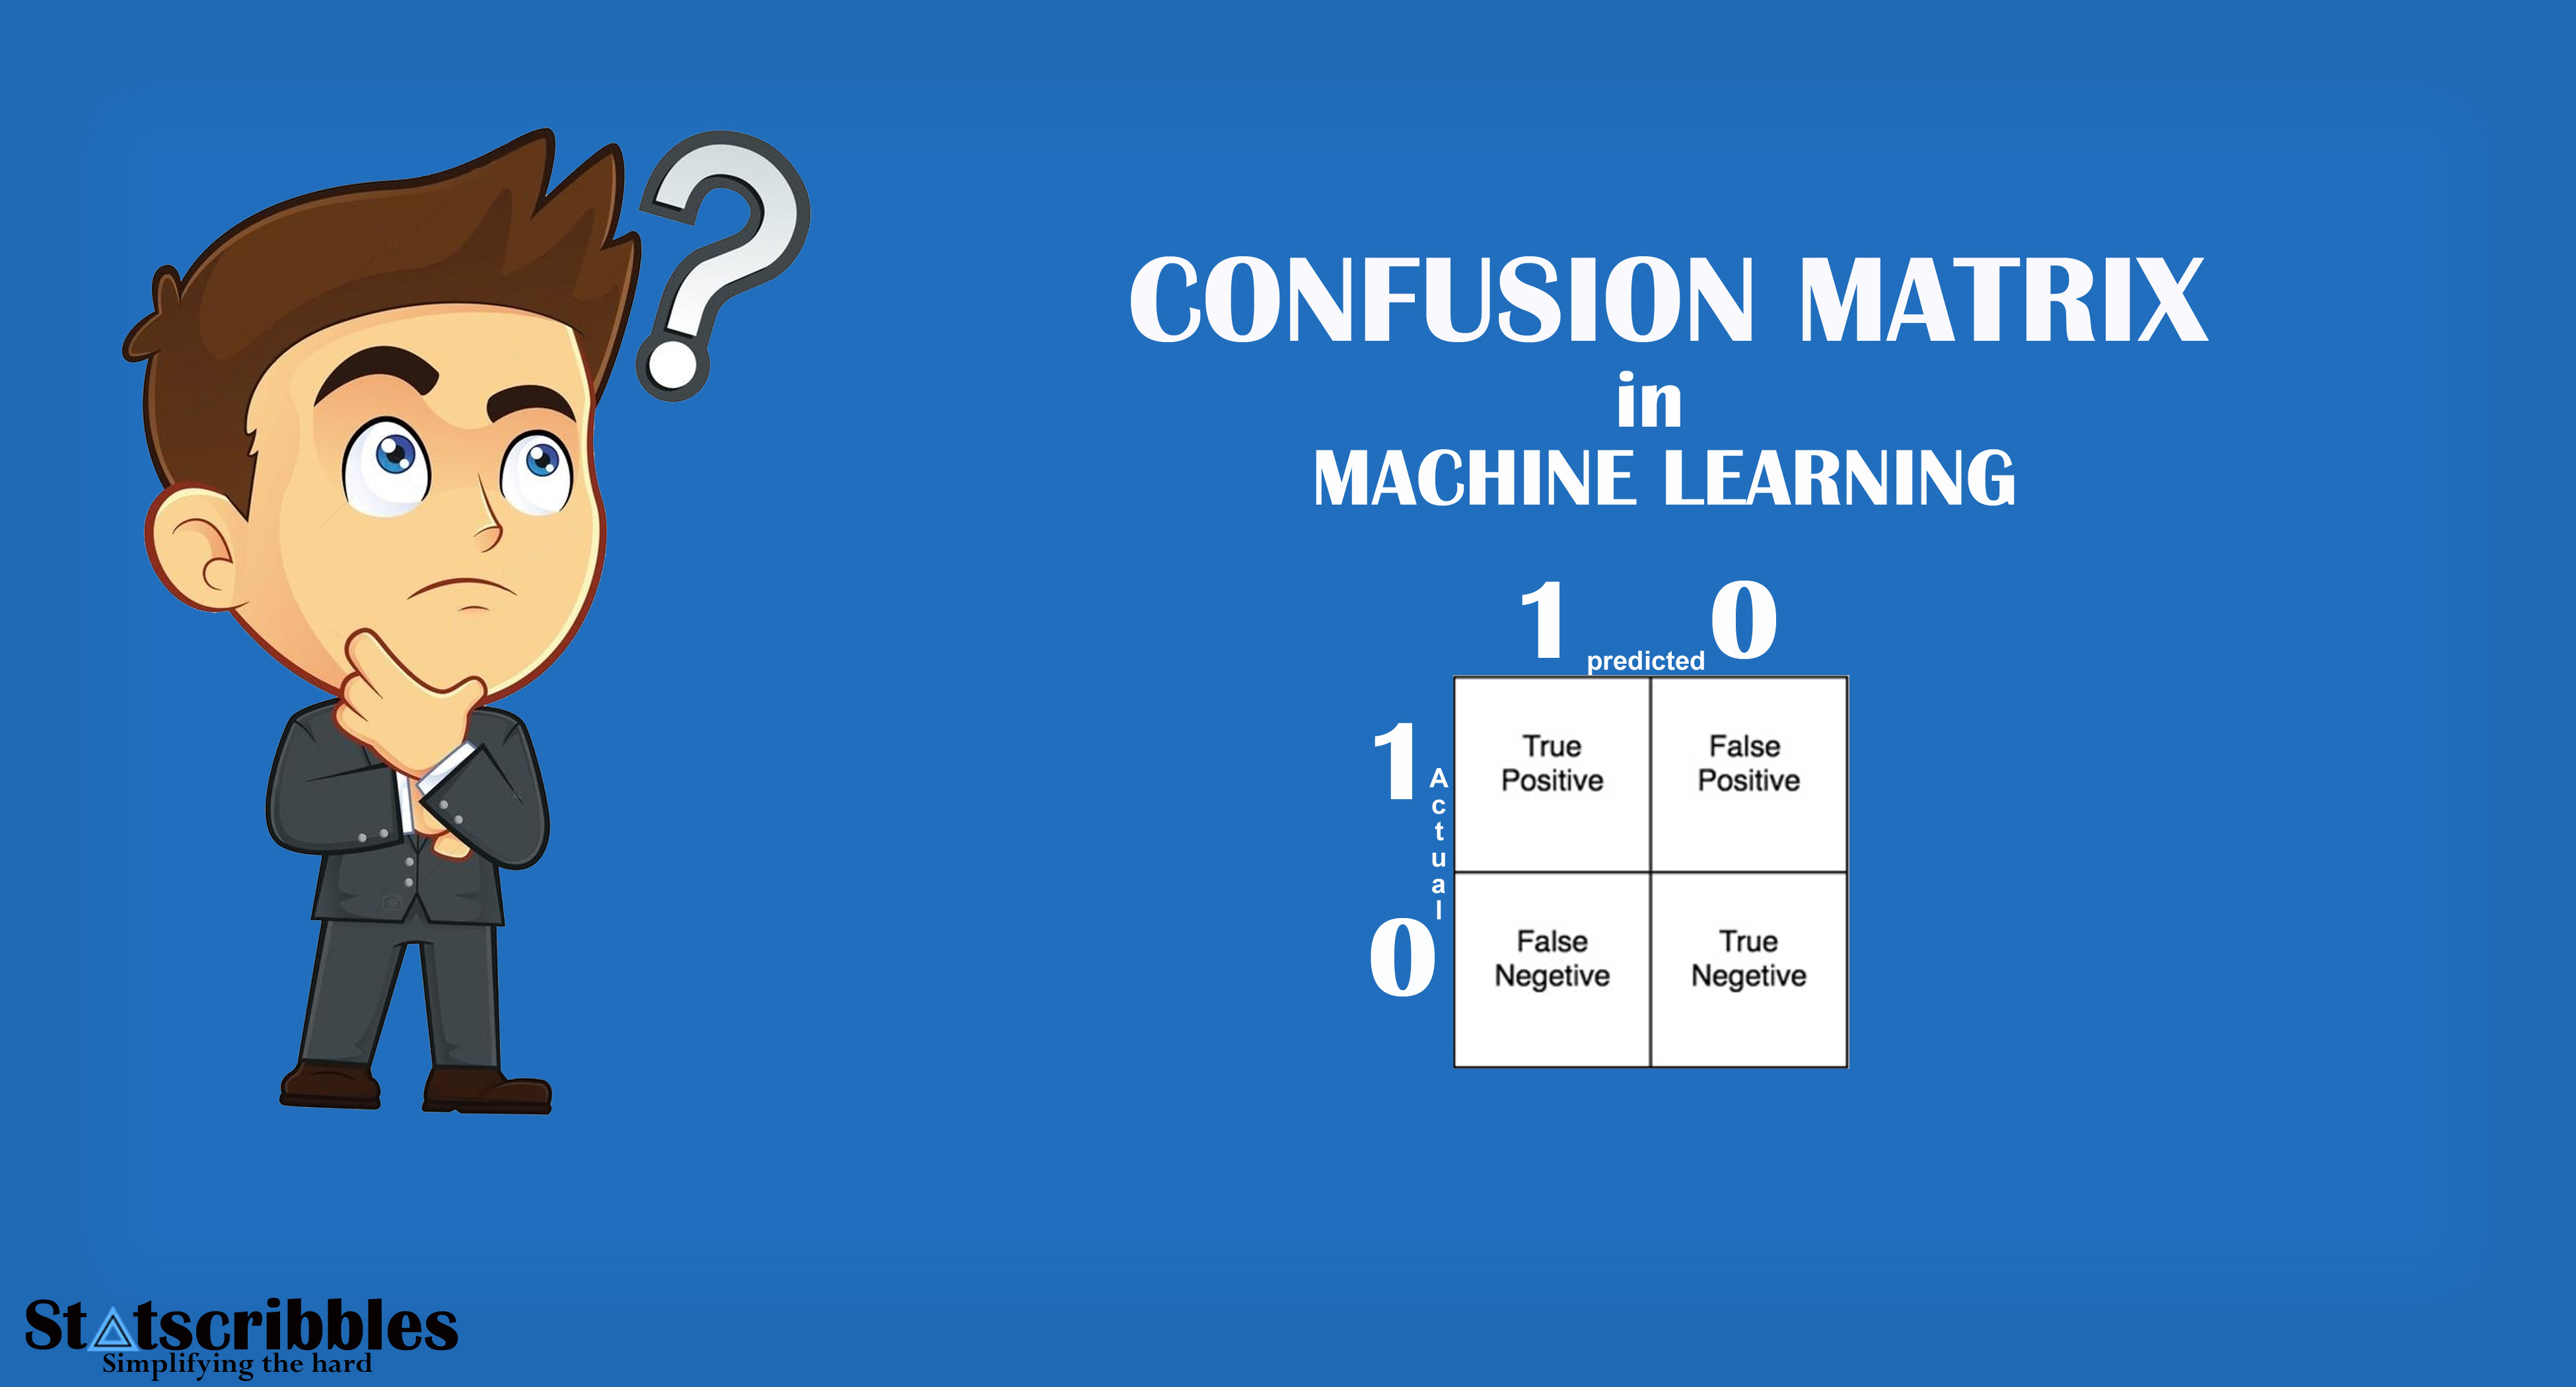
In simple terms, the Confusion matrix is an evaluation metric used to measure the performance of a machine learning model.
Let’s imagine that we have created a machine learning classification model that can identify whether an image is a dog’s image or a cat’s image. Now we need to know how many images have been correctly classified and how many have been incorrectly classified. The confusion matrix comes in handy to help us.
While classifying the images of Dogs and Cats there are four possibilities.
- Correctly Identify Dog’s image
- Correctly Identify Cat’s image
- Incorrectly identify Dog’s image as Cat
- Incorrectly identify Cat’s image as Dog
The four possibilities listed above are explained by the confusion matrix’s four main terms.
- True Positive (TP)
- True Negative (TN)
- False Positive (FP)
- False Negative (FN)
Let’s consider Dog’s image as a positive class and Cat’s image as a negative class.

True Positive
When the actual image is Dog’s image and our classification model also predicts it correctly, it is True Positive. In other words, it has Truly identified the Positive class. In our above example, we have 52 True Positive cases.
True Negative
When the actual is Cat’s image and our classification model also predicts it correctly, it is True Negative. In other words, it has Truly identified the Negative class. In our above example, we have 35 True Negative cases.
False Positive (Type 1 error)
When the actual is Cat’s image, but our classification model predicts it as Dog, it is False Positive. That is, it has Falsely classified it to be a Positive class. In our above example, we have 8 cases of False Positive.
False Negative (Type 2 error)
When the actual is Dog’s image but our classification model predicts it as Cat, it is False Negative. In other words, the model has Falsely classified it to be a Negative class. In our above example, we have 11 cases of False Negative.
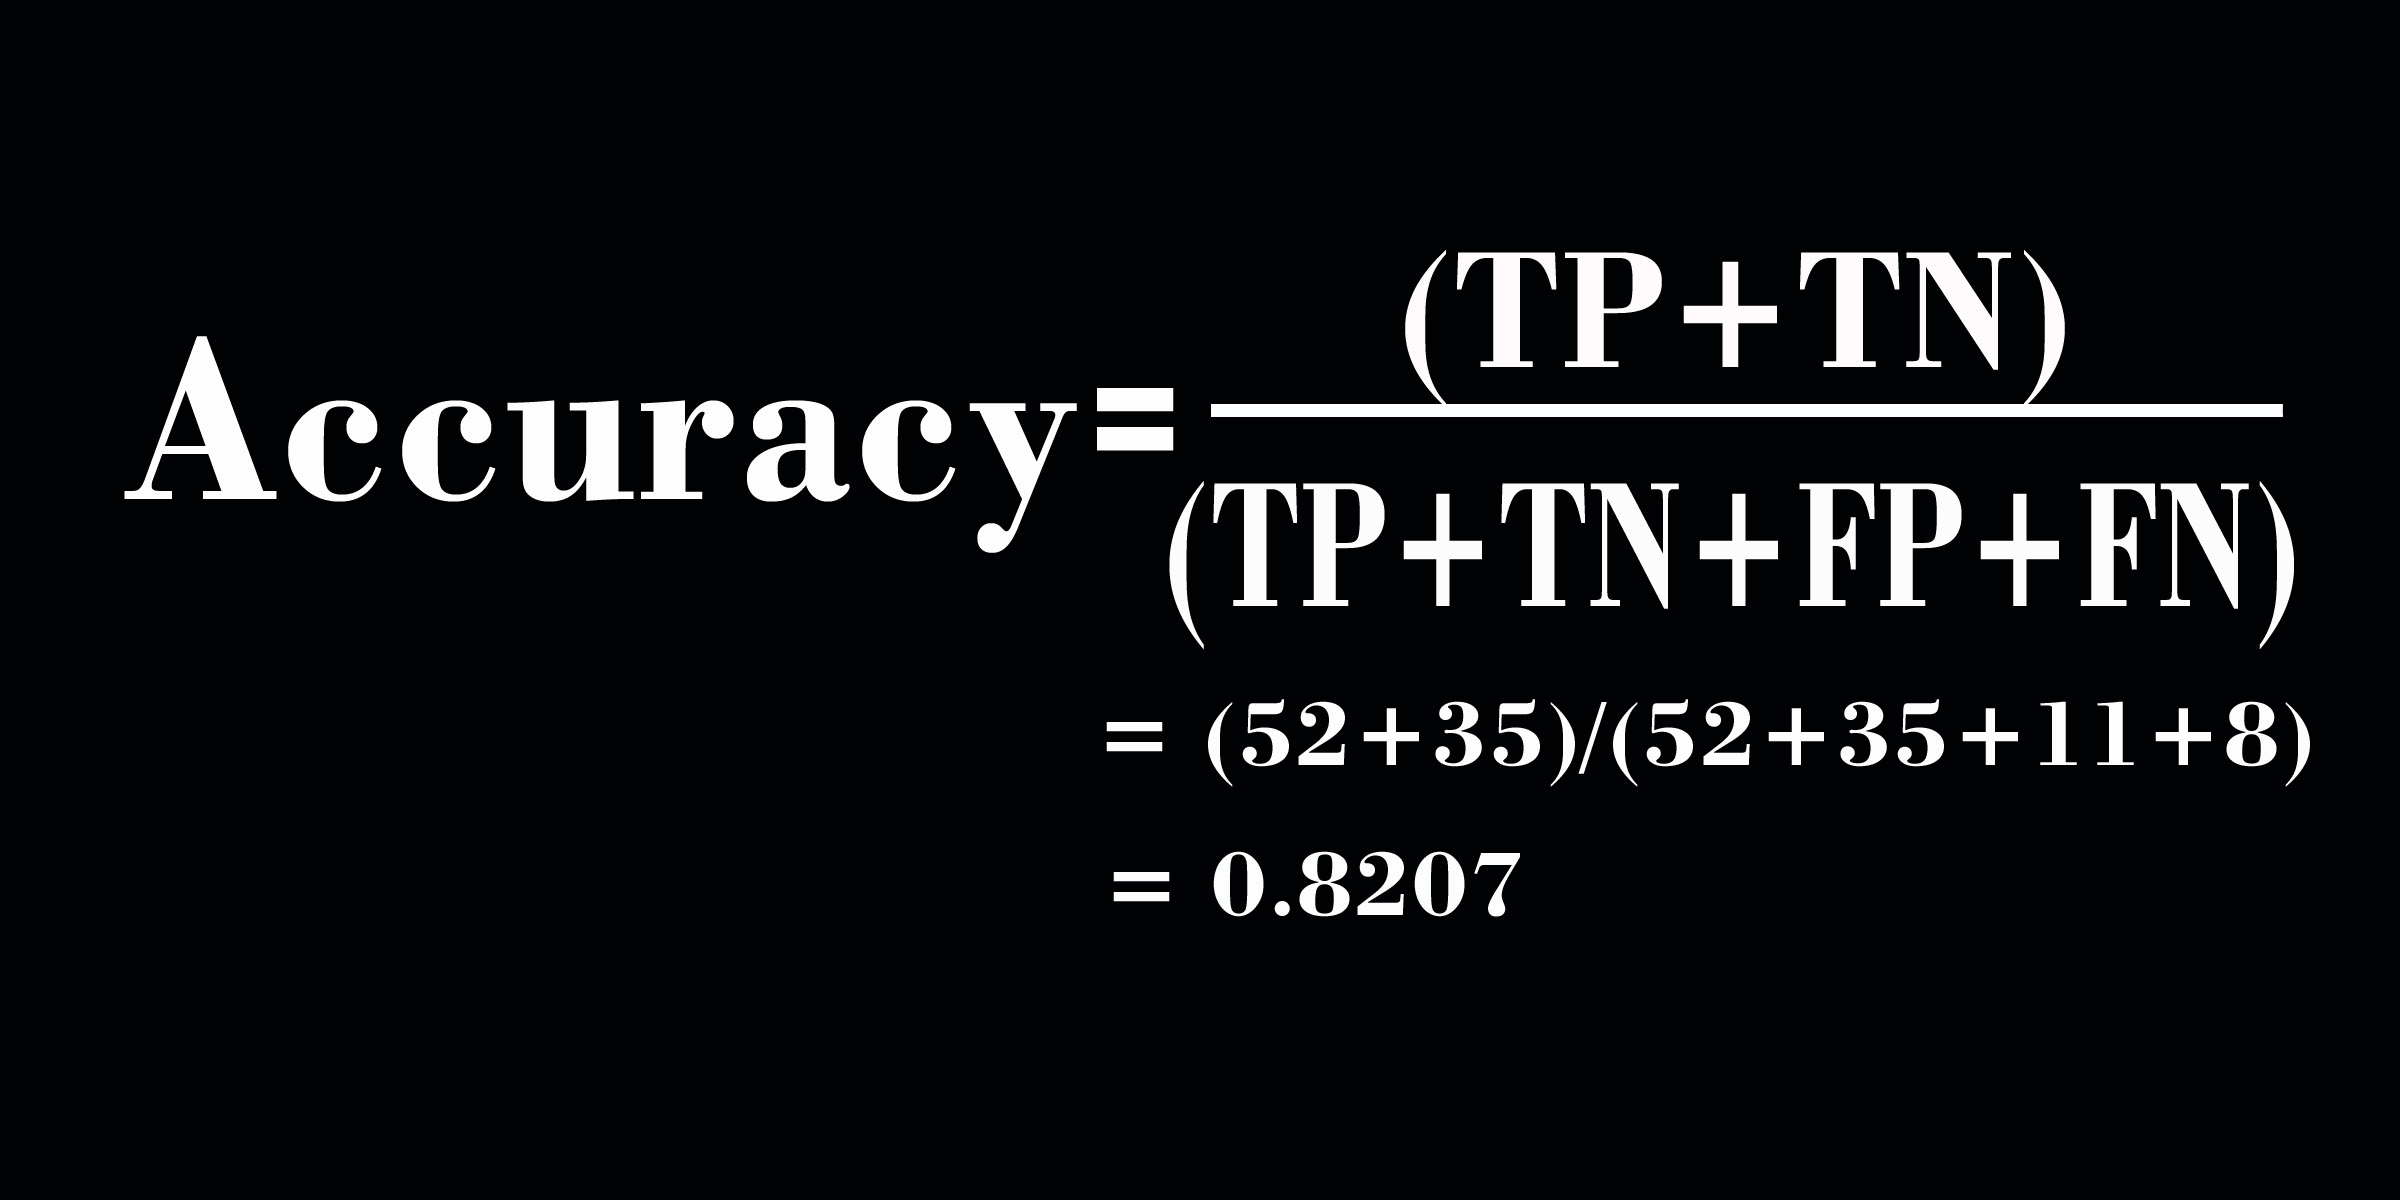
We can calculate other metrics like Accuracy, Precision, Recall, and F1-score using TP, TN, FP, and FN.
Accuracy
Accuracy measures, how correctly our model has predicted the positive and Negative classes. The formula’s numerator is TP+TN (Total number of classes correctly identified as Positive and Negative), and the denominator is TP+TN+FP+FN(All). Higher the Accuracy, the better our model. In particular, accuracy is not the best metric when your dataset is imbalanced.
Precision
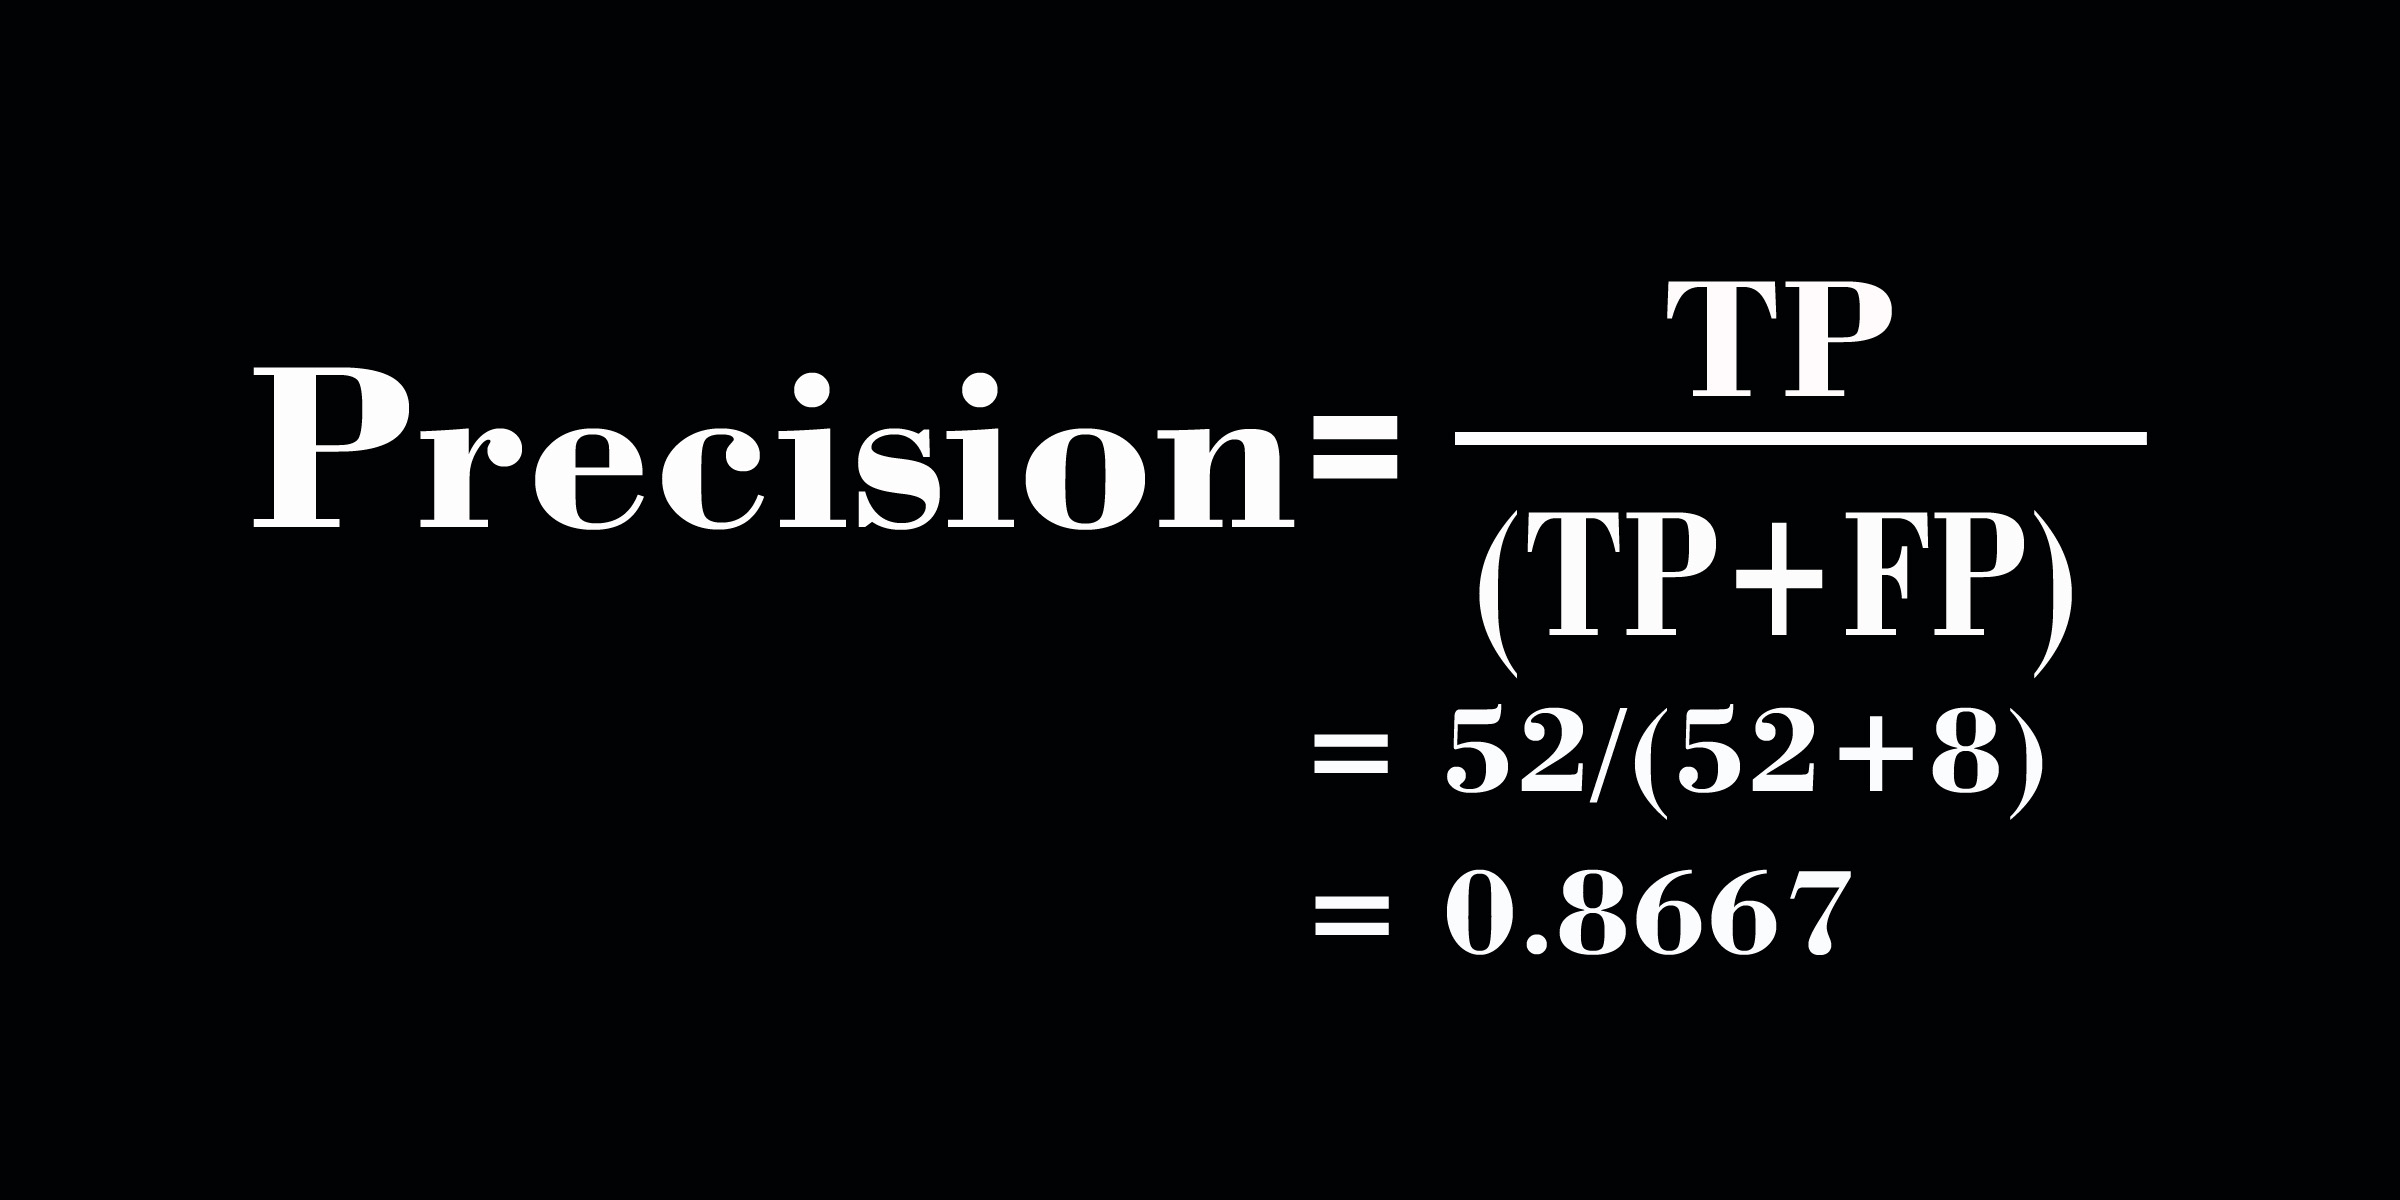
Precision measures, out of all Positive predictions, how many are truly positive? In the formula, the numerator is TP and the denominator is TP+FP. So if False positive cases increase, our precision score decreases, and vice versa. Hence If we aim to reduce the False Positive cases, then Precision becomes our optimal metric, and we need to focus on improving it.
Recall
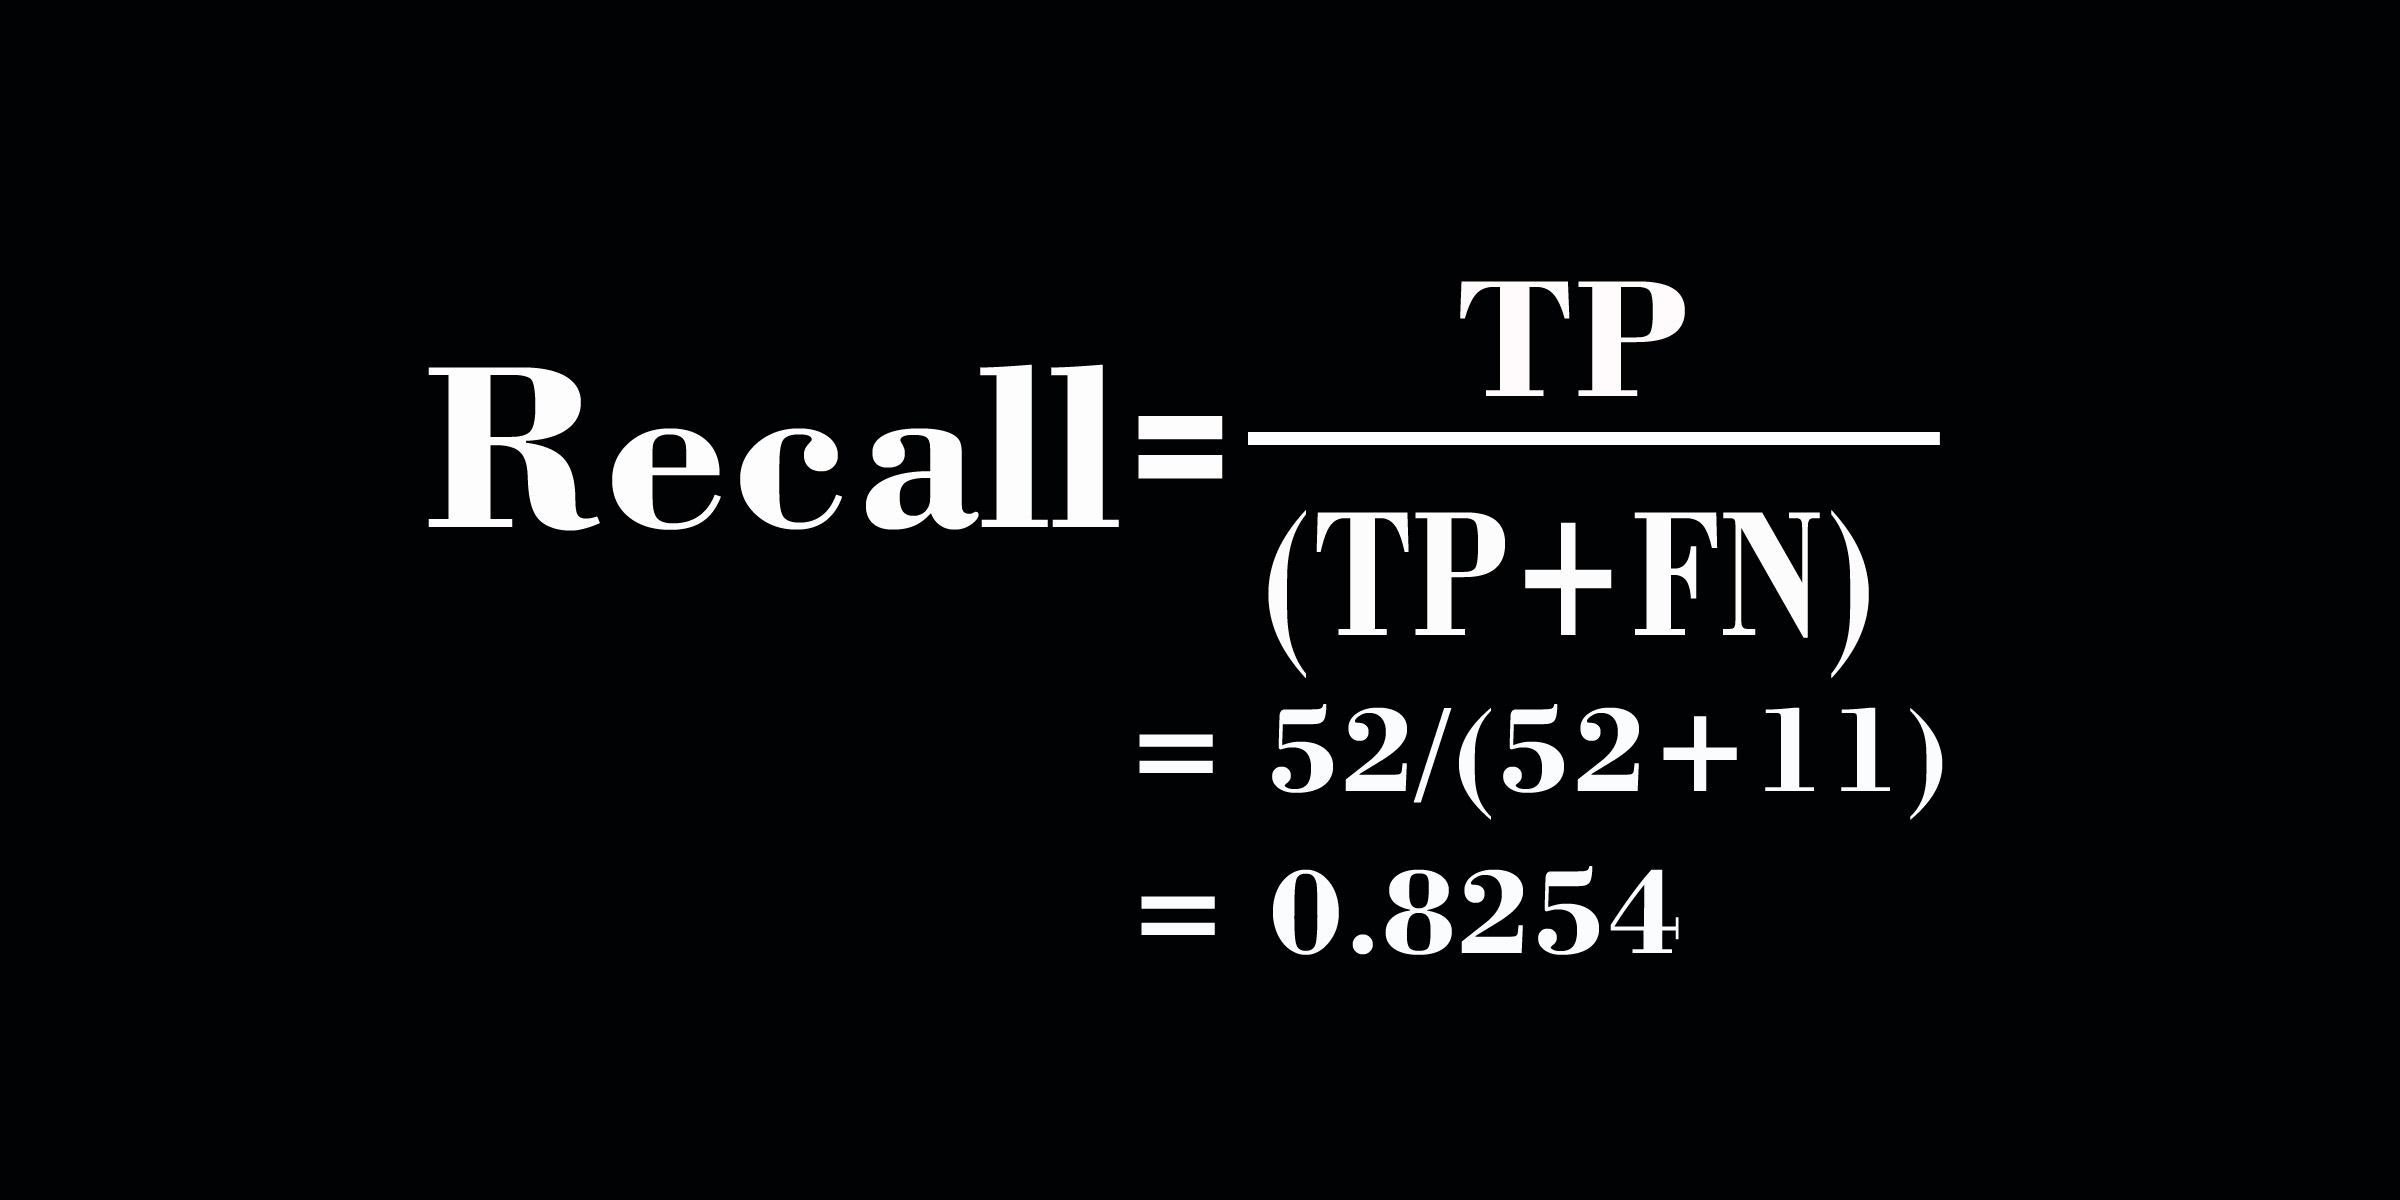
Recall measures, out of all Actual Positive cases, how many have been correctly identified as positive by our model? In the formula, the numerator is TP and the denominator is TP+FN. So if False Negative cases increase, our Recall score decreases, and vice versa. Hence If we aim to reduce False Negative cases, then Recall becomes our optimal metric, and we need to focus on improving it.
F1-Score
In our problem statement, if it is crucial to maintain both False Positive and False Negative rates, then the optimal metric is the F1-score. It takes the harmonic mean of Recall and Precision.
The main reason to take the harmonic mean instead of the simple average is that the simple average gives equal weightage to all the values involved in the calculation, while the harmonic mean gives more importance to the low value and penalizes the higher value.
For example, if precision is 0.3 and recall is 0.9, then our simple average would be 0.6, which means the model’s performance is good. But our precision score is very low, so we will have more False Positive cases. The harmonic mean is 0.45, which means the model’s performance is not that good. It took into account the low precision score we had.
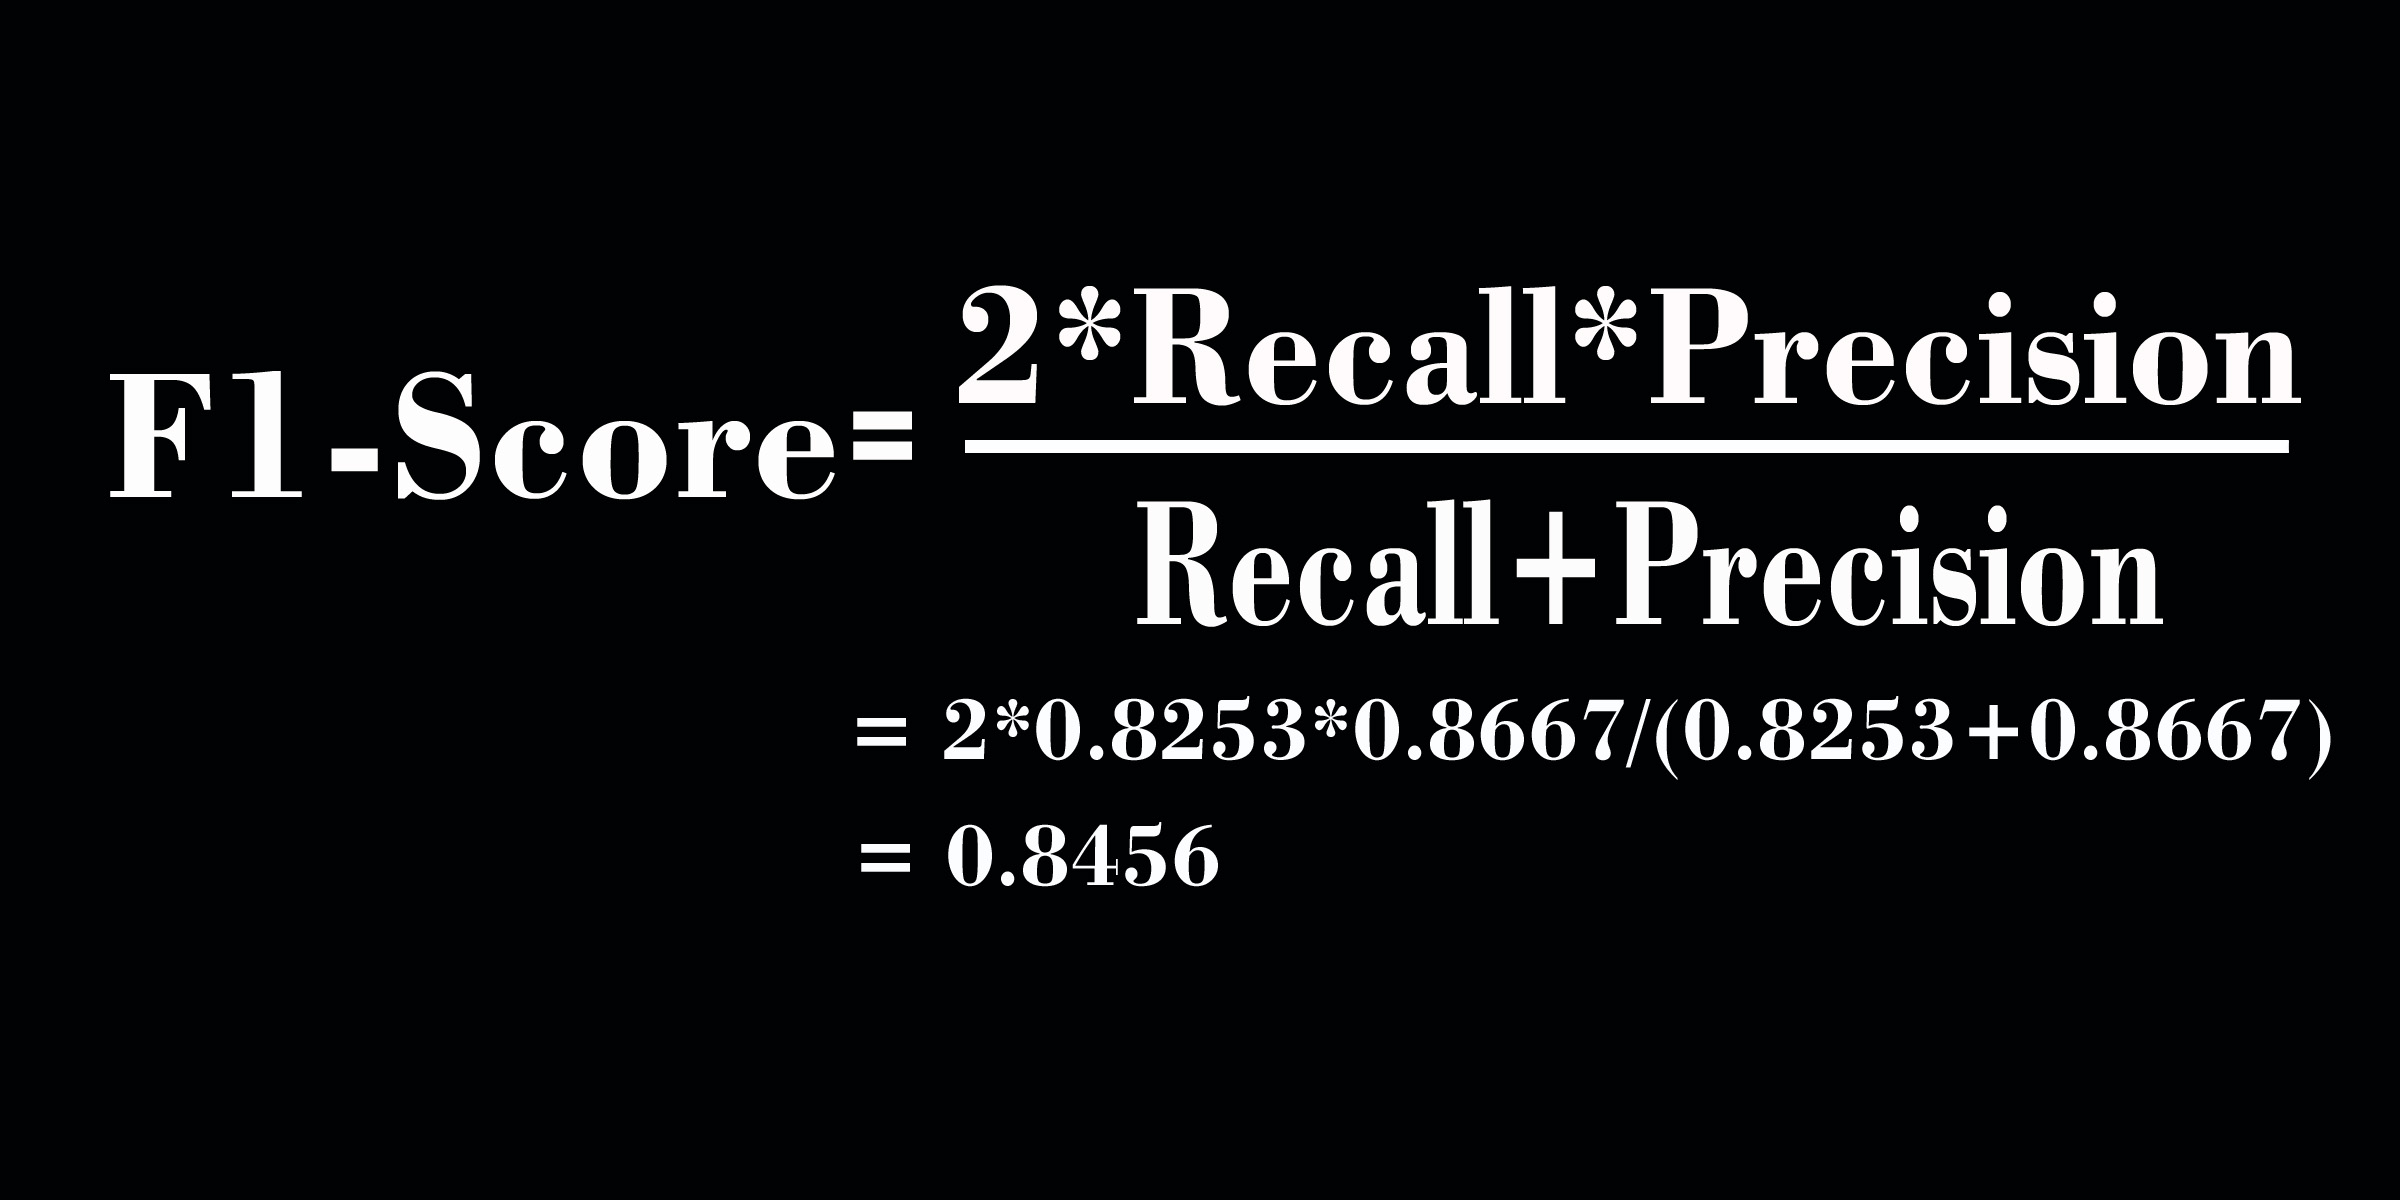
The more simplified version of F1-score formula will help us understand it more easily.
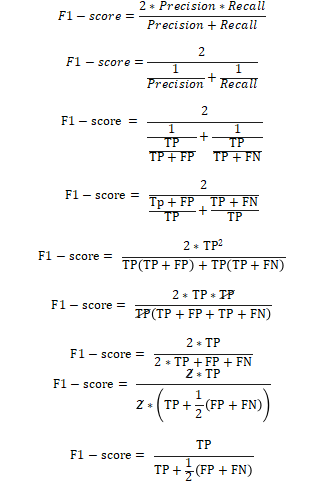
In the above formula, we can see that equal weight is given to both FP and FN, so the harmonic mean takes care of the extreme values of FP and FN. Hence F1-score becomes an optimal metric to have a balance between FP and FN.
Conclusion
I hope that this blog post helped you understand the Confusion matrix and the metrics that go along with it. Although we used a binary classification example, the Confusion matrix is so effective that we can also use it for problems involving multiple classes of classification.
